
Preface:
In a typical system, there are usually three type of models involving in simulation or analysis:
- IBIS/IBIS-AMI: At the both ends of the channel are driver and receiver models, usually in the forms of spice, IBIS and/or AMI.
- RLGC: Interconnects with homogeneous structure such as transmission line and/or layer stackup are usually 2D/2.5D field solved and represented with frequency dependent RLGC matrices
- S-Parameter: Complicated passive structures such as package, connector or via must be solved with full-wave simulation to have accurate representations, which are almost always S-parameter.
In the recent years, due to the popularity of link analysis for low BER requirement (i.e. various SERDES interfaces), S-parameter has become more and more important. A s-parameter is now often used to represent the full channel (package + t-line + via + connector etc). In addition, there are lab measurements from VNA which are also in the form of S-parameter. Even when behavior models (broadband spice circuit) of these components are used for time domain simulation, they are also converted originally from S-param via algorithms like rational fitting.
Each of these S-parameter may have their own noise sources, bandwidth limitation or numerical inaccuracies. As a result, one has to check the quality of the S-parameter models to avoid numerical errors or instability (e.g. simulation convergence) of the analysis at the later stages.
There have been several documents floating on the web discussing about checking list for a given S-parameter, albeit lack of systematic approach or industrial support across different vendors. For this purpose, IEEE P370 committee was formed in 2015 to discuss and define a spec. as a reference. Task group 3 of this committee focuses in particularly on the S-parameter quality check. As a participating company in this joint effort since the very beginning, also as the spec. draft is coming into shape at this moment, we think it’s a good time now to share the collective thoughts and also demonstrate how these ideas are implemented in tool like our flag ship product, SPIPro.
S-Parameter quality check:
A S-parameter checking list can usually be classified into two categories: generic check and application specific check. This post focuses on the generic check, which is defined as checking based on their physical properties. For the latter one, application specific condition such as signaling speed, typologies, modulation method or even coding are further imposed. Generally speaking, there are several generic checks need to be done:
- Passivity: to make sure data is passive and has no amplification
- Causality: to make sure properties of cause and consequence are maintained
- Reciprocity: to make sure data is symmetric
- Even/Odd/Asymptotic behavior: to make sure even and odd behaviors are maintained at both DC and high frequencies
- Connectivity: to make sure connectivity of structure extracted is correct and has no broken link(s)
In addition, reports from all of these check should be presented clearly with an overview and further details available. The overview summary should also use a single number for each check as well as quality metric coded with color for different level:
- Good: Green
- Acceptable: Blue
- Inconclusive: Yellow
- Bad: Red
- NA: for information only, such as connectivity
Numerical criteria for these levels depends on the types of check. Lastly, visual checks should also be used in some cases to provide frequency specific information such as where the issue happened.
Full mathematical details and explanations of the sections below will be in IEEE P370 spec.. It will be made available free to public upon completion. We will not duplicate the details here but only giving high level description and demonstration usage below.
Passivity:
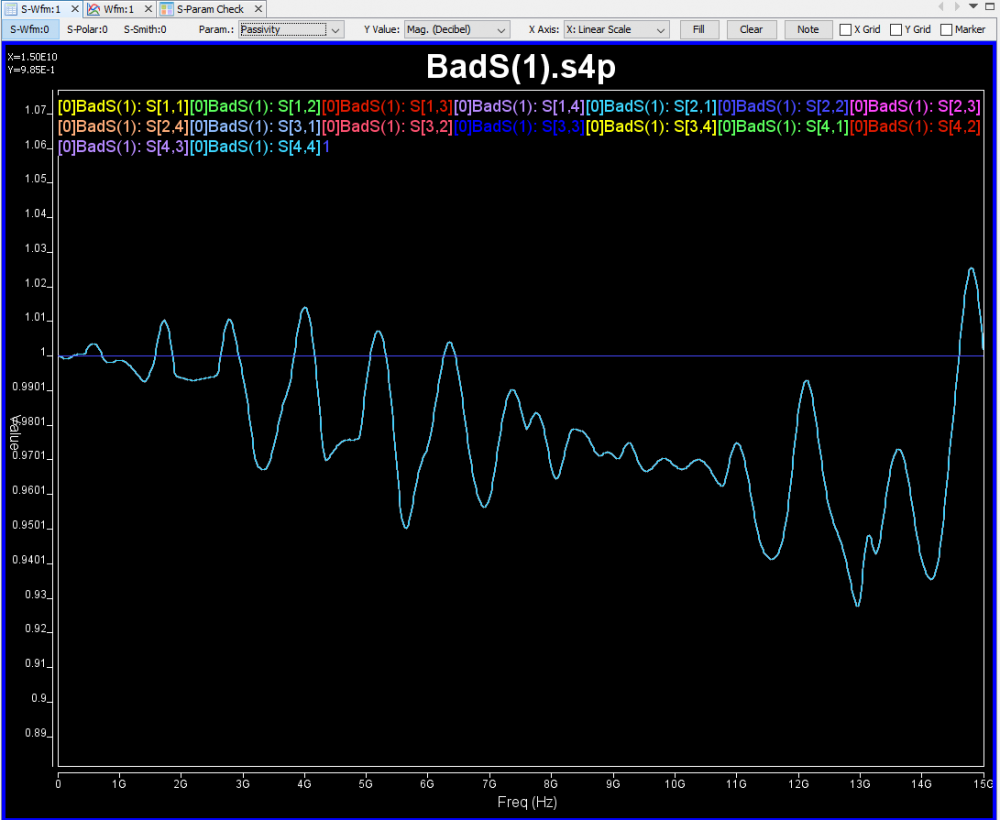
Power injected into a S-parameter, which includes those from incident and reflected waves, should be preserved without amplification. When this is true, then S-parameter is passive and does not contain any energy source. Mathematical requirement is:

Visually, we can plot the given traces (Sij) and see whether they cross threshold of 1.0:
And/or compute a summarized metric, Passive Quality Metric (PQM):
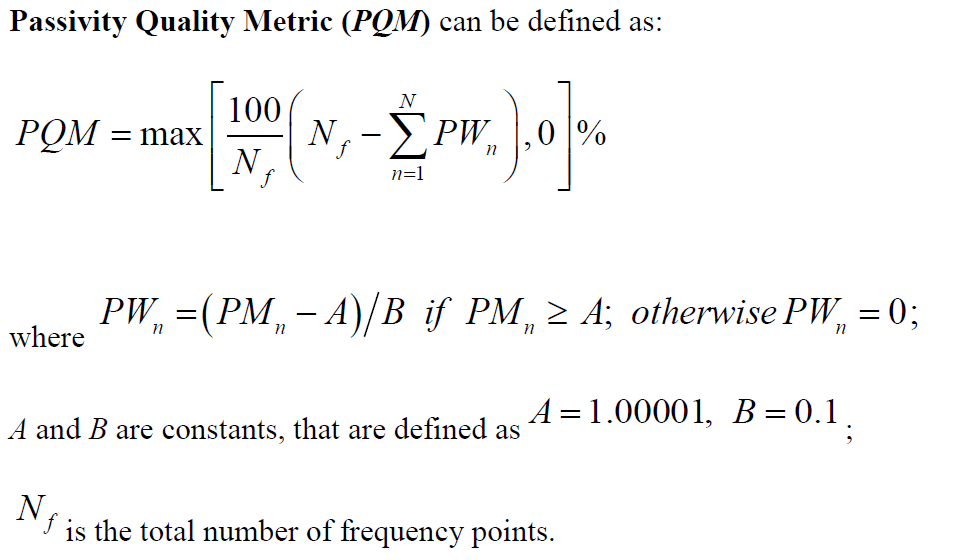
reported as a single value: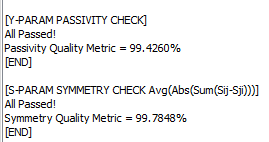
One way to fix a non-passive system can be use the largest (violated) value to normalize the rest such that no value is larger than 1.0, thus passive.
Causality:
Causality check is the most important, yet more complicated one for a S-parameter. A necessary but non sufficient condition of being causal is that the even and odd function behavior of the real and imaginary data at DC should be satisfied. Adding being passive across full frequency range will make the condition sufficient. So a causality check essentially includes many of the other checks needed for a s-param.
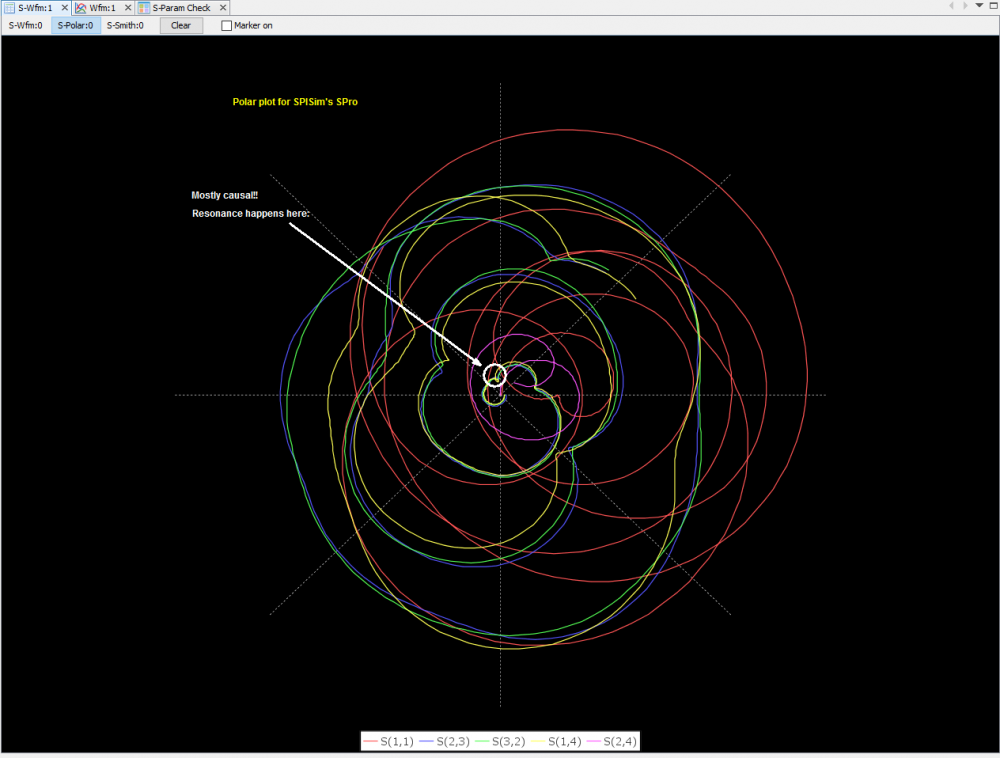
Due to the complexity of the math, such comprehensive check is not easy. As a result, a visual check (heuristic) may be used. This check is based on the observation that a polar plot of a causal system rotates mostly clockwise and is often very smooth. The small inner circle is usually where resonant happens which may degrade the causality of the overall data:
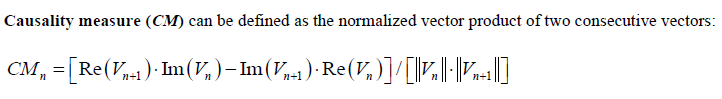
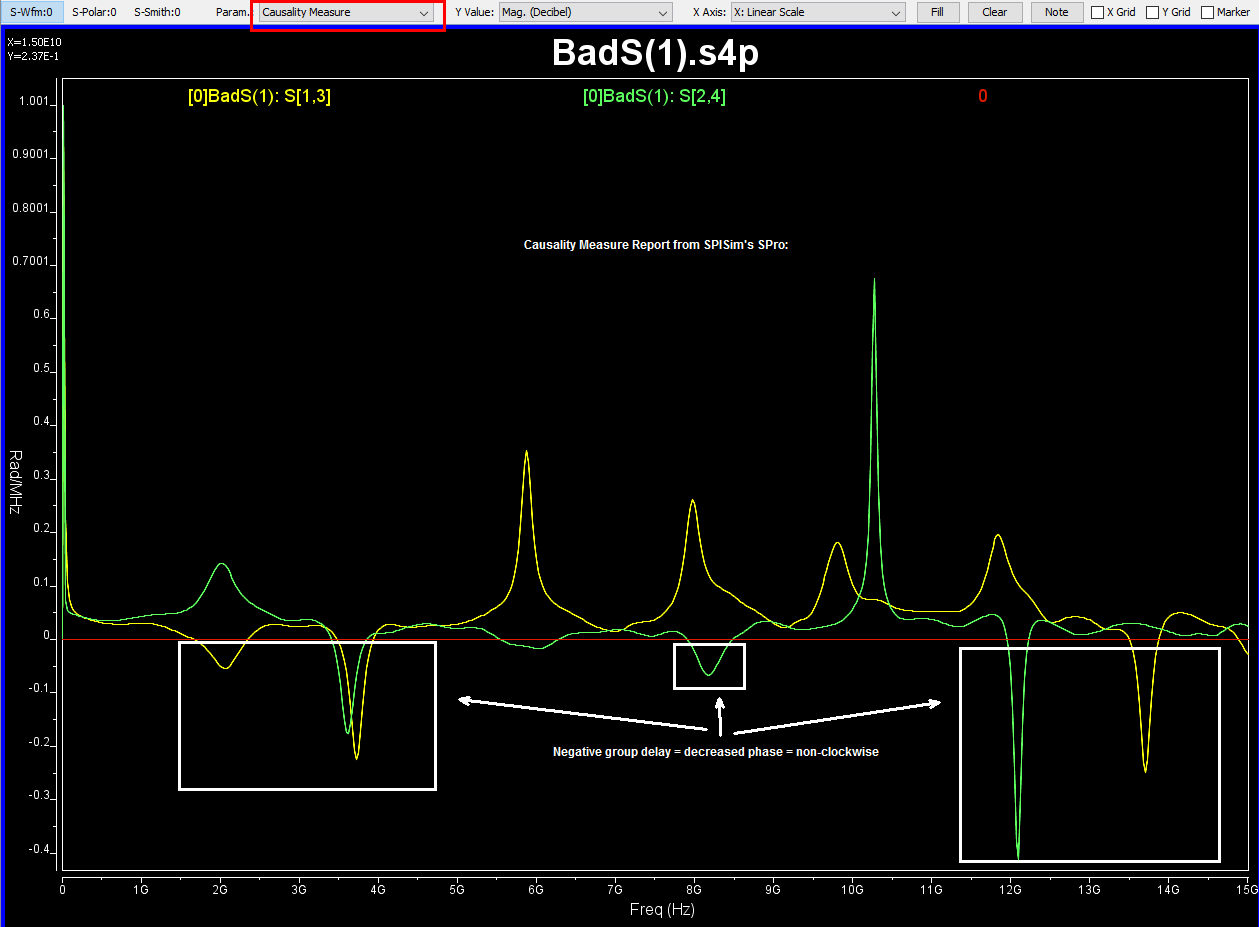
The progress of phase between two adjacent vectors (Sf0, i, j to Sf1, i, j) can be calculated and normalized with their dot product and magnitude. The results should be a value falling between -1 ~ 1. Negative value represents decreasing group delay and thus a counter-clockwise phase change between these two vectors. This is where resonance has occurred. One can plot such measure against each frequency and got its visual representation:
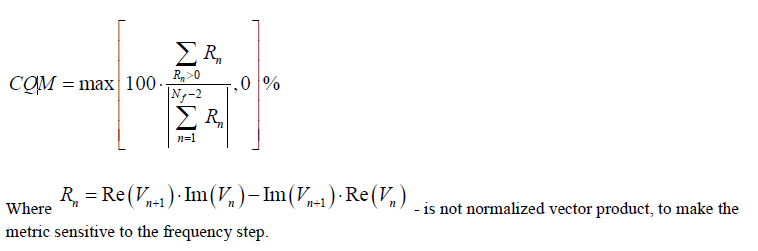
Often time, through type traces of a given s-parameter (S12 or S21) are used for iFFT for corresponding pulse or impulse responses. One can calculate this for each frequency of each through through type signal and have a summarized metric: Causality Quality Metric (CQM)
And report can contain more details about violations of different frequencies: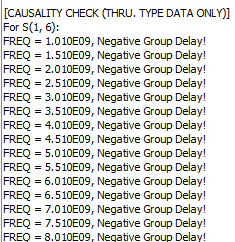
The fix of a non-causal system usually involves reconstructing a causal system with parameters fit the given data. Vector fitting or rational approximation are such approaches, which will be discussed in future post in more details.
Reciprocity:
As a s-parameter is passive, it should not be directional regarding input and output ports. Thus a S-parameter’s content should be symmetric across the diagonal part. Note that this may not be the case for materials which has non-diagonalizable property such as ferrites, yet it should hold true for most of the materials used in system elements and materials.
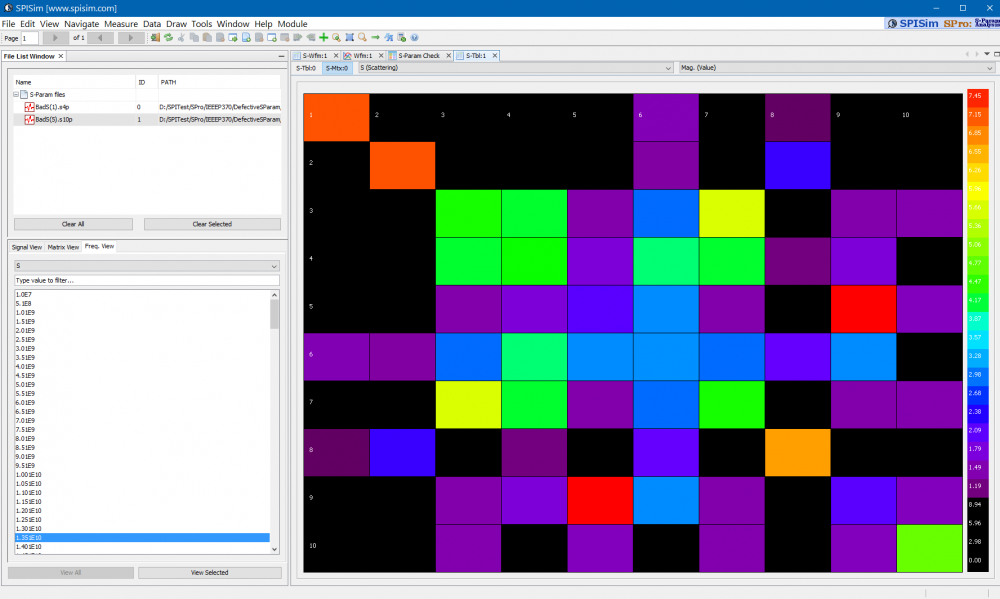
For a large multi-port system, color coded cell values can be used as a visual check for symmetry (reciprocity):
This needs to be done at least at the first (low) and last (high) frequency content. Regarding an overall evaluation, a Reciprocity Quality Metric (RQM) can be used:
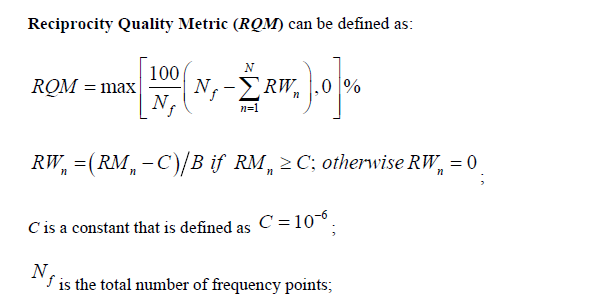
A reciprocity violation’s fix is usually the easiest… one may average values from both sides of diagonal and replace in place.
Even/Odd/Asymptotic behavior:
This check is based on the fact that a transfer function should be equal to its conjugate in the negative frequency domain:
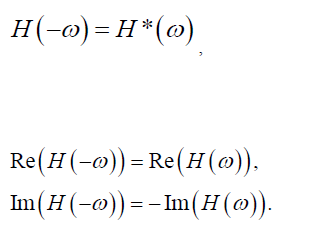
As a result, the real part of the data should be an even function while the imaginary part should be an odd one. That means at the dc level, the real data should be flat across freq = 0 axis while the image should cross origin point. Also at the highest frequency, the imaginary data should approach zero. One can think of all the inductive and reactive elements such as capacitors and inductors are either open or short at the lowest (DC) and highest (infinity) frequency point, thus make the transfer function real only.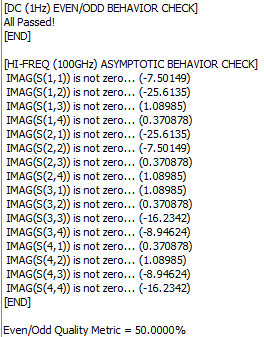
This even/odd/asymptotic behavior is very useful when the extrapolation toward DC and highest frequency points are needed, such as the case for TDR/TDT from iFFT. DC point in frequency domain will affect the corresponding DC value at the time domain, while the highest frequency available will decide the resolution in the converted data in the time domain.
Connectivity:
This is to make sure the structure the s-parameter extracted from does not contain any broken channel. A simple conversion of S-parameter to Y or Z parameter and check their value should reveal the connectivity. Usually doing so at the first data point (low frequency) is enough. Color coded matrix value again will be very useful especially for large s-parameter matrix:
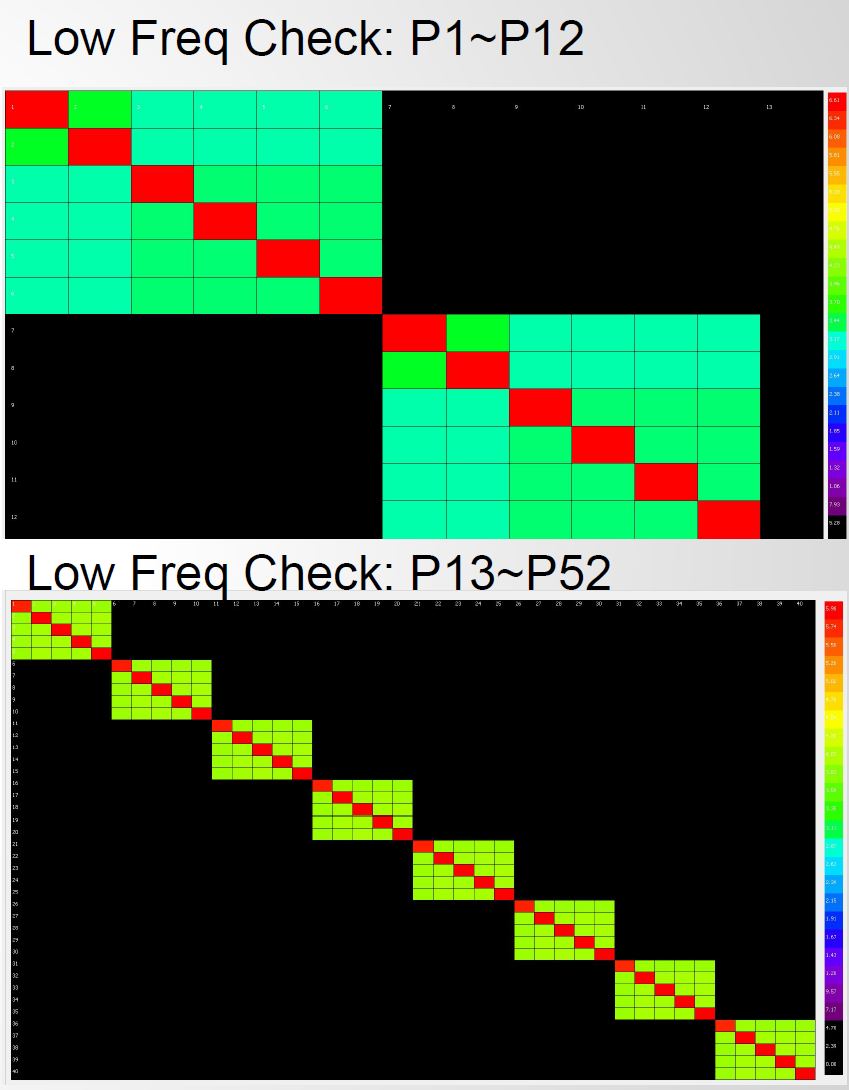
The example shown above is for a full DDR byte lane which involves many DQ and a pair of DQS signals. As DQS is differential, it may also be useful to separate them from the rest of the data with proper scaling for better distinction.
Report and summary:
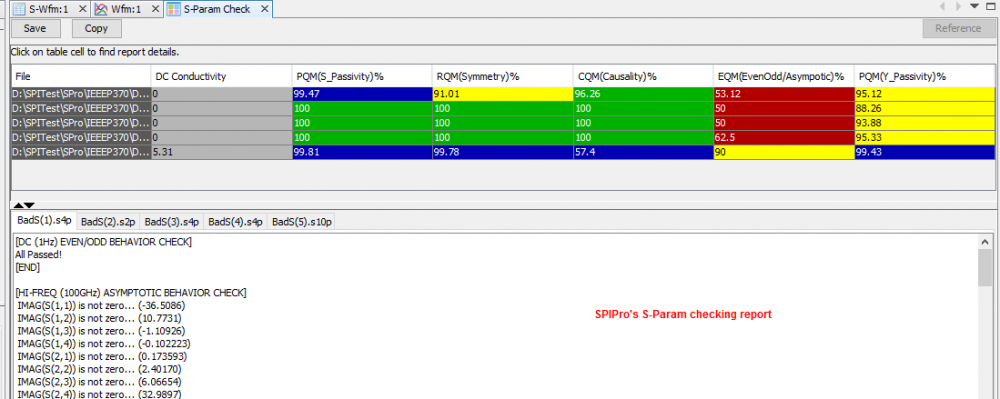
To apply these checks to more than one s-parameter, a batch mode process is often preferred and will save lots of mouse clickings: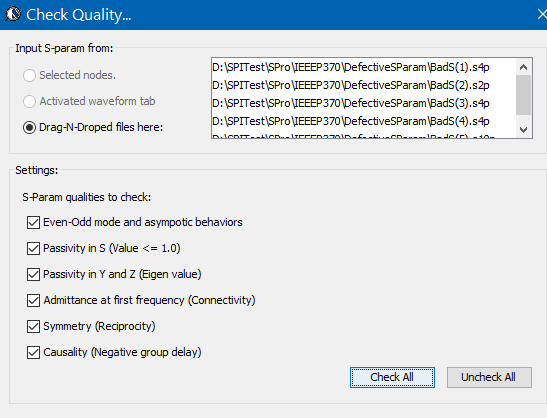
The produced summary should contain with color coded cell and various quality metric number, plus further details for each check of different data. This will certainly gives user better idea about the quality of their s-parameter files.
All the screen captures used in this post are from our SPIPro product, which also implemented all the checks according to the IEEE P370 spec. draft.
Pingback: SERDES 通道分析三部曲 | SPISim[使必信科技]: 信號完整性、電源完整性暨電路擬真軟體
Pingback: S-Param indicators: ILFitatNq, ILD, ICN, ICR, IMR, INEXT, PQM, CQM... | SPISim: EDA for Signal Integrity, Power Integrity and Circuit Simulation
Hello, I have a question regarding your causality quality metrics (CQM) formula. Is there some mistake in the description? Please note that as you have written it, taking the absolute value of the sum over Rn (in the denominator) the numerator will ALWAYS be greater than the denominator since:
|sum_{n=0…Nf-2}{R_n} | = |sum_{R_n > 0}{R_n}- sum_{R_n <=0} {|R_n|} | 0} {R_n}.
Shouldnt you be taking the sum of absolute values instead, i.e. the denominator is sum_{n=0…Nf-2}{|R_n|} ? Otherwise the ratio will always be >= 1 and thus you will get more than 100% CQM.
In addition, how do you compute the overall CQM of the S-parameter file? Is it the average CQM over all entries S(i,j) of the S-parameter matrix?
Thanks for your kind response.
Hi, Thanks for your comments.
You may find relevant info/script here at the P370’s git page: https://gitlab.com/IEEE-SA/ElecChar/P370
Our tool does show <100CQM for some suspect s-params. so the calculation should not be an issue. However, I do need to check what I have written in the post to make sure it's correct. Will put that in my bin list 🙂