

SPISim’s VPro Overview:
Design concept:
Waveform viewer is an essential part of signal integrity tool. This is especially true in SPISim’s SPIVPro (VPro for short). In addition to frequency domain and time domain waveform viewing of many commonly used format, such as tr0, ac0, mat and csv file, it also serves as a bases to derive more SI focused analysis, such as transmission line, S-parameter and IBIS data inspectors as additional add-ons. We spent much efforts when conceptualizing and develop our waveform analysis module from ground up to make sure it has comprehensive analysis capabilities and can also meet future design challenges’ needs.
Environment:
VPro is a top-level module runs on SPISim’s framework. This means VPro is cross platform, has all in one environment and support further extension via add-ons such as TPro, SPro, DPro and more. VPro by itself provide comprehensive, end to end, general waveform analysis capabilities for system analysis.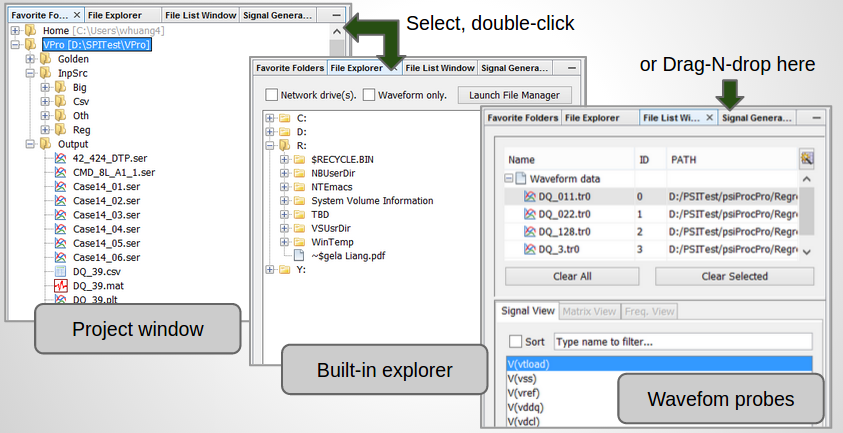
SI/PI analysis features:
VPro has SI/PI analsis capabilities only seem in other much more expensive tools from different vendors. Here are some of its features highlight:
- Multi-format input and output: VPro supports most common waveform formats and system model format such as snp/citi, tab/rlc and ibis. In addition, it allows output of csv and mat format for further customized analysis.
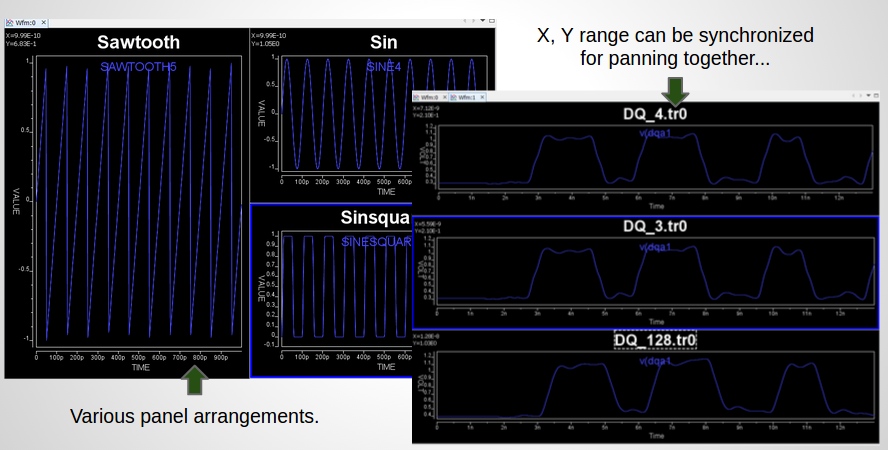
- Mutli-pane synchronized or non-synchronized viewing: Signals across different panels of various layouts can be zoomed and panned together for easy comparison.
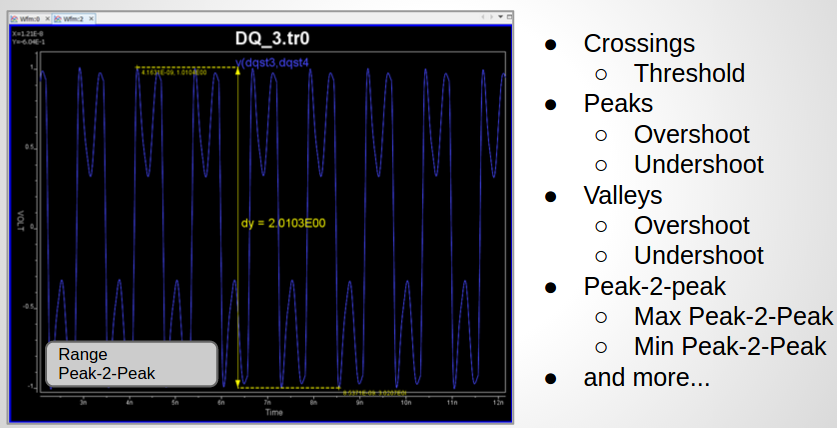
- More than 30 SI focused measurement: edge crossing detection of rise/fall only or both, peak and valleys of overshoot/undershoot detection globally or within certain range, as well as min/max peak-to-peak detection and more are all supported in VPro.
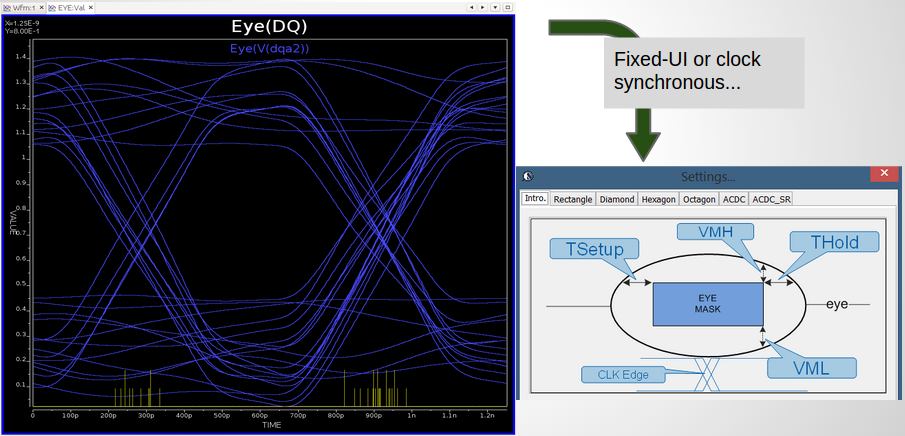
- Strong data and waveform analysis functions: Time domain operations such as clock synchronous or fixed UI eye plot, frequency domain spectrum analysis like FFT/iFFT, correlation, windowing of ~15 filters are all part of the data analysis capabilities.
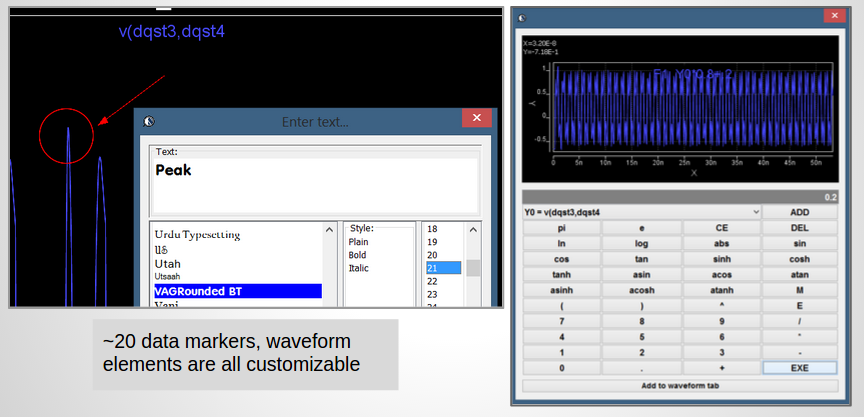
- More than 20 SI focused data markers: User can easily mark dX, dY, dXY, slopes and common markers like arrow text or even eye mask for easy data review and reporting.
- Waveform calculator: VPro has waveform calculator which can apply math to a particular or a group of waveform signals. Calculated traces can be previewed first before transferring to regular waveform viewer pane for further analysis or export to disk.
- Signal generator: detailed in next topic.
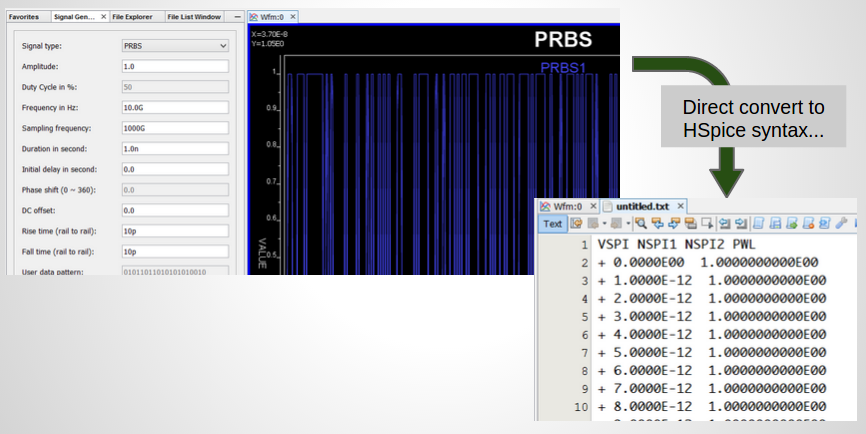
Signal generator:
VPro also comes with built-in signal generator add-on which provide 13 signal functions. From basic sin, sinsquared, sawtooth to gaussian, pink noise and PRBS are all supported. In addition, all signal parameters such as delay, amplitude, frequency are customizable and generated result can be transfer to viewer pane for further signal analysis or translated into spice syntax directly.
In summary, SPISim’s VPro provides cross platform, easy to use yet powerful waveform analysis capabilities to meet SI/PI engineers’ daily tasks’ needs.