
In previous post, we talked about exploring solution space linearly using what-if analysis. When more comprehensive or a near global search for best/worst performance is desired, a systematic approach must be used.
Response surface modeling (RSM):
System output responses Y1, Y2 shown below may have both controllable and uncontrollable input variables X and Z. In system analysis, the output is obtain via circuit simulation mostly and is thus deterministic. As a result uncontrollable factors maybe lumped into constant term and the mapping between controllable factor, X, to its output can be viewed as a multi-dimensional surface like shown in the right below. Search of optimized combination is like searching for maximum or minimum on the curvature.
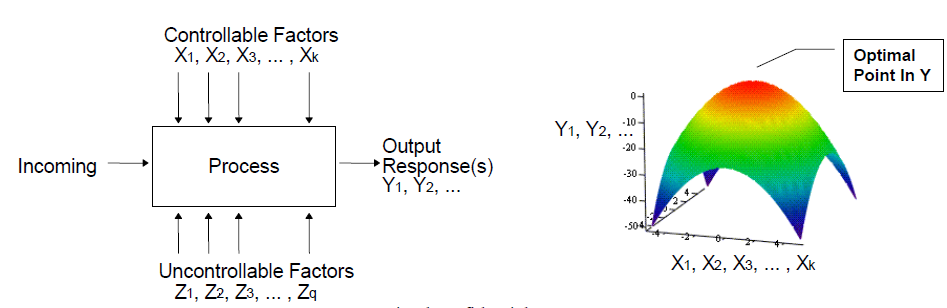
This type of “mapping” from x to y is called “response surface modeling (RSM). It takes many sampling points to construct such response surface. A design of experiments (DOE) method is often used in this RSM approach.
Design of experiment (DOE):
When more than several variables are involved and each of them has a range of possible values, using full grid (full combination) to do exhaustive search for best combination is really not feasible.
If a performance measurement, Y, is represented as a function f(x) of design variables x1, x2 ~ xn, then we can use a Taylor series to approximate f(x)

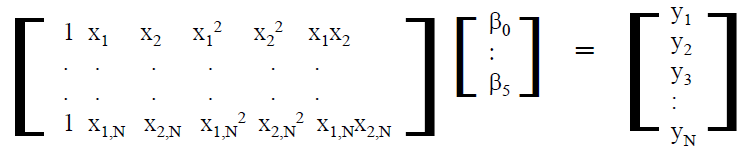
The higher order (bigger value of alpha above) to be included as part of the series, the more accurate it will resemble the original function f(x). It’s a little like decomposing time domain square wave in frequency domain using FFT. In system analysis, just like in many phenomenons in real world, f(x) is dominated by lower order terms. Take two variable and two order maximum as an example, the equation above can be further simplified as the following quadratic form:
![]()
Different value of input variables (X1, X2.. etc) will have different output performance Y. When more than several sampling points are taken, then the equations can be written as an matrix form, each row represents a sampling run:
When further generalize to all the variables, a linear system is formed:
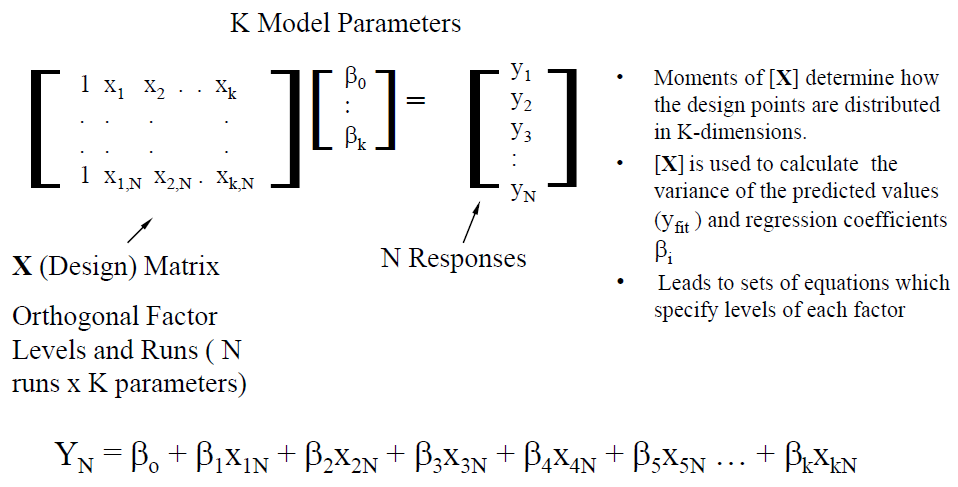
With this, one can use linear algebra technique such as pseudo inverse and/or singular value decomposition to solve for coefficients beta such that the error is minimized (optimized) in the mean squared error (MSE) sense.
Using this DOE/RSM methodology, several decisions needs to be made in advacne:
- Selection of input variable X and order: only dominate variables should be used to minimize the number of columns;
- Selection of output target Y: output target obtained by mathematical operation (post-processing) may loose the lower order relation to original variable x;
- Choice of sampling algorithms and number of samples: each row of the matrix corresponds to a “simulation” run, the samples must cover enough design space to make solution meaningful while minimize impact due to the noise of modeling.
DOE analysis flow:
A systematic optimization flow based on DOE/RSM thus includes the following steps:
- Define variables: only dominate variable should be used in the analysis. A trivial variable will increase the matrix size and have very small coefficient (beta). The selection of dominated variable may be identified from experience, previous analysis run, linear sweep or what-if analysis. The DOE flow may also be performed several times, with non-significant variables being removed at the end of each iteration.
- Create sampling points: There are several sampling algorithms when choosing sampling points. The choice should be made based on design’s coverage, optimality and efficiency. For SI/PI, when number of variables is around 10, central composite design is a good choice as it is full quadratic with only about 1000 design to run. D-Optimal is a good choice when number of variables is bigger (up to 30). When using neural network for final modeling, full quadratic is not needed and a space filling type design is a good choice. All these designs are available in statistic software package and subset of them have been implemented in our MPro module.
- Create corresponding test cases: Regardless of the design, a variable’s range needs to be decided. Depending on whether a variable is categorical (non-continuous) or numerical (continuous), possible step value may be decided. A generic representation usually use -1, 0, and 1 in the design table to represent minimum, typical and maximum variable values. Then next step is to translate such settings into corresponding design. For netlist type circuit representation, pattern replacement is sufficient. For geometric synthesis which require further mathematical manipulation using these design variables, a more flexible mapping mechanism should be provided. At the end of the stage, each row of the design table will be translate to a corresponding circuit design in order to be simulated.
- Simulate and post-processing: A simulation manager is often desired in this step in order to distribute testcases to run on different CPU threads or different machines. A post-process step is executed right after simulation ends to extract performance matrices from the results. Outcome of this step is a row of output measurement for each test case run.
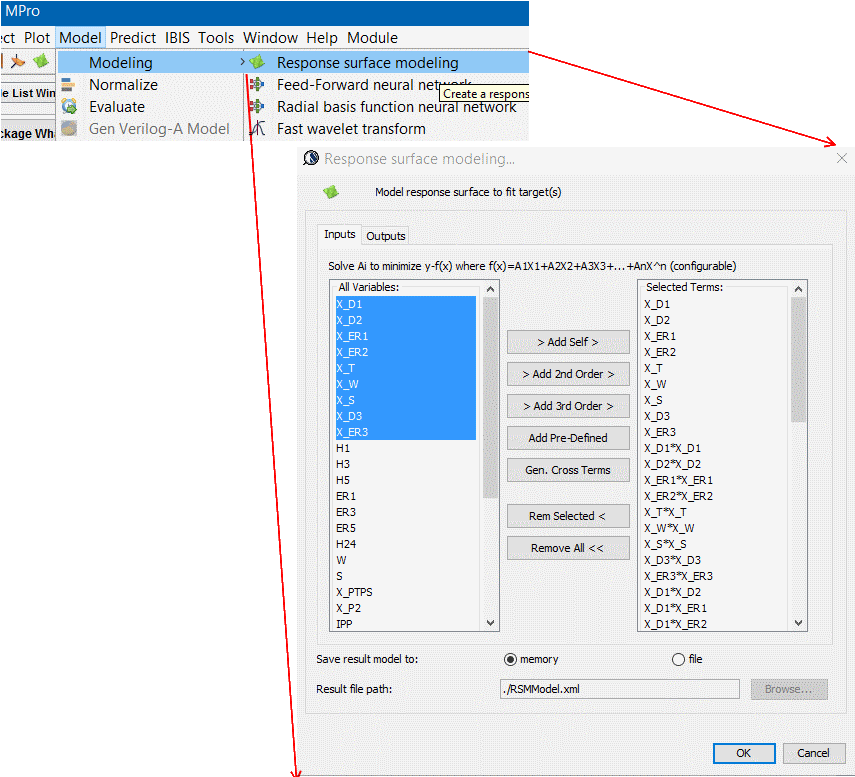
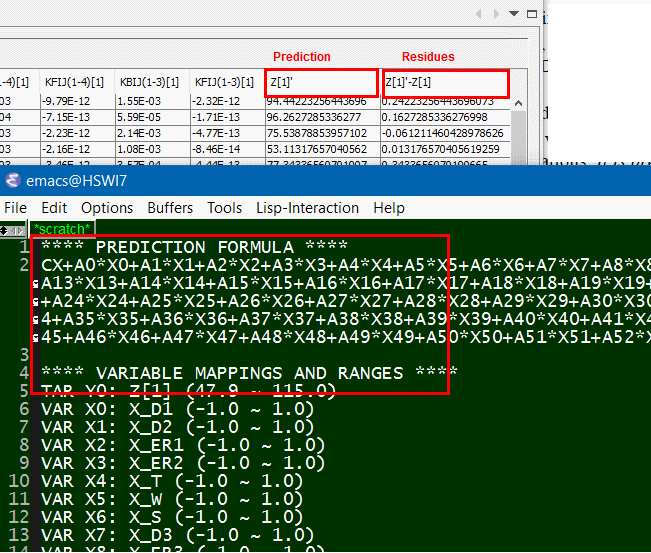
- Map inputs to outputs: Form a second or third order equations using defined independent variable, then solve for their coefficients using SVD solver. Residues values which is difference between original response and “predicted” one based on solved formula can then be calculated. A well fit model will have very small residue. A R^2 value, which is the portion of variation attributed to the model can be used to indicate the fit. A R^2 >= 0.95 is usually desired.
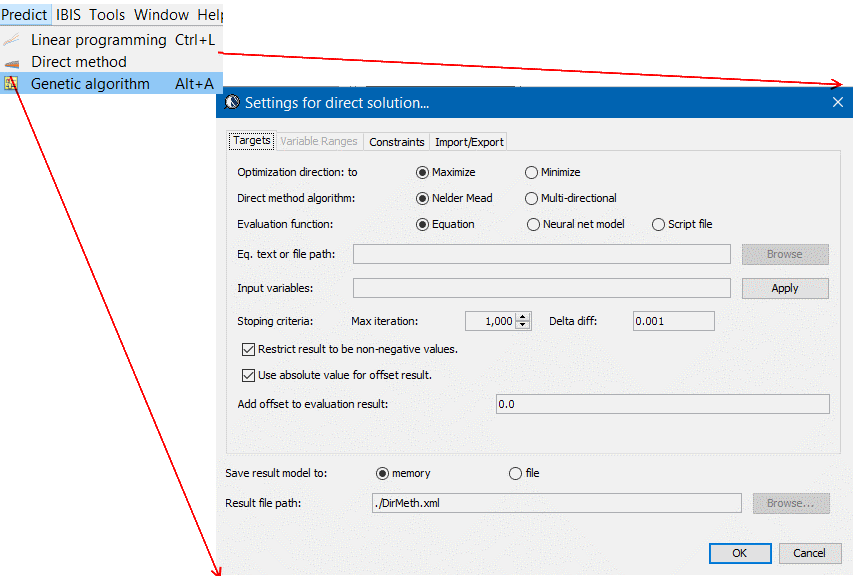
- Optimize: Constraints such as non-negative value and must fall within variable range needs to be imposed. Based on these restriction, solution to minimize or maximizing a cost function, which can be weighted sum of several performance targets, can be searched. Depending on the order of the prediction formula constructed, different type of optimization method can be used:
- Linear programming: good for formula with only first order variable, which is usually the case for stackup performance based on geometric parameters;
- Non-linear method: when formula has higher order terms, method like Nelder algorithm may be used;
- Genetic algorithm: when model is highly non-linear or neural network based, this algorithm is best to search for optimized solution.
- Prune variables for next iterations: As the variables’ coefficients reveal their significance toward the output Y, some of them may be removed for next iteration analysis. A significance list may also be formed as a reference in the design process.
As one can see, a systematic flow such as DOE/RSM requires much more efforts and intermediate steps comparing to a simple linear sweep or what-if analysis. On the other hand, a well fit prediction model can also be served as a base of quick “what-if” analysis to replace time consuming simulation and be used as an initial guidance when using design variables.
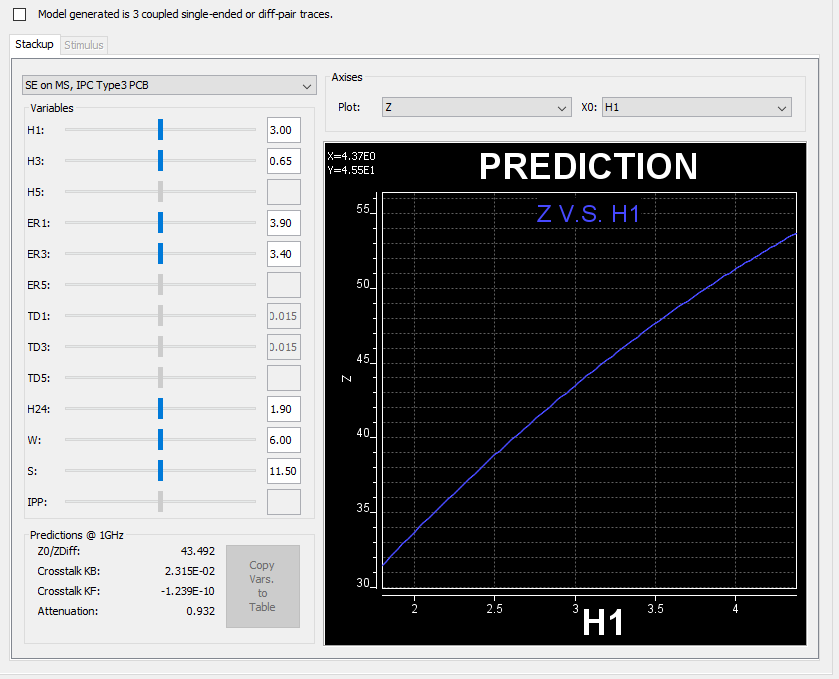
A stackup what-if based on model built via DOE/RSM flow